Kube Scheduler Metrics in Kind Clusters
Context
While experimenting with kube-scheduler on a local Kind cluster, I was interested in its metrics. Unfortunately, they were not readily available. There were two issues:
- Kind (and the underlying Kubeadm) default configuration binds the scheduler metrics server only to the loopback interface. Furthermore, it does not configure a
Servicefor accessing the metrics. - RBAC is enabled by default, therefore we need to configure a
ClusterRolethat allows our workloads to access the control plane metrics.
Both issues can be observed by the fact that, out of the box, we are forced to port-forward to kube-scheduler in order to make HTTP requests, but even then, we still fail to fetch the metrics:
$ kubectl -n kube-system port-forward pod/kube-scheduler 10259:10259
Forwarding from 127.0.0.1:10259 -> 10259
Forwarding from [::1]:10259 -> 10259
$ curl -k https://localhost:10259/metrics
{
  "kind": "Status",
  "apiVersion": "v1",
  "metadata": {},
  "status": "Failure",
  "message": "forbidden: User \"system:anonymous\" cannot get path \"/metrics\"",
  "reason": "Forbidden",
  "details": {},
  "code": 403
}
Solution
First, we need to set the --bind-address command line argument for kube-scheduler to 0.0.0.0. This can be done by creating a custom Kind config:
kind: Cluster
apiVersion: kind.x-k8s.io/v1alpha4
name: my-cluster
nodes:
  - role: control-plane
    kubeadmConfigPatches:
      - |
        kind: ClusterConfiguration
        scheduler:
          extraArgs:
            bind-address: "0.0.0.0"
  - role: worker
We can launch a new Kind cluster with kind create cluster --config /path/to/kind-cluster.yaml. We can verify that it worked by checking the Pod spec for kube-scheduler:
$ kubectl -n kube-system get pod kube-scheduler-my-cluster-control-plane -o yaml | grep command -A5
  - command:
    - kube-scheduler
    - --authentication-kubeconfig=/etc/kubernetes/scheduler.conf
    - --authorization-kubeconfig=/etc/kubernetes/scheduler.conf
    - --bind-address=0.0.0.0
    - --kubeconfig=/etc/kubernetes/scheduler.conf
Then we will need to configure a Service for the kube-scheduler metrics, as well as a ClusterRole and ClusterRoleBinding to access them.
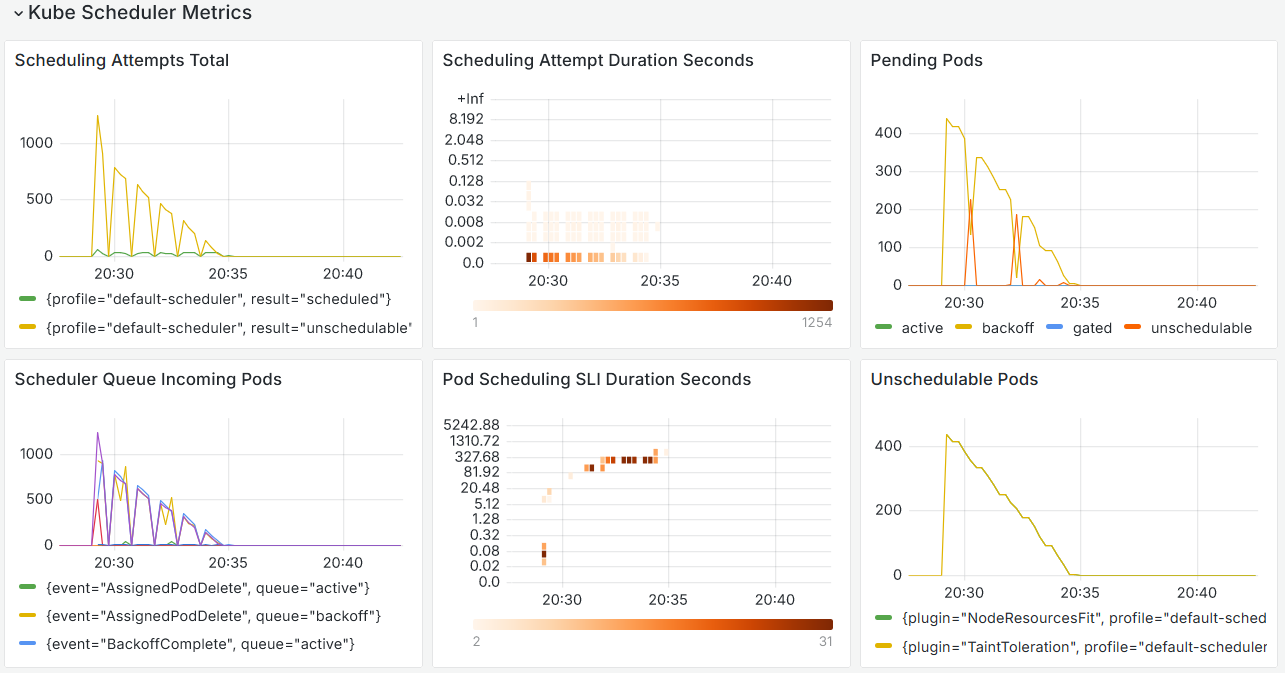
To make use of the metrics in a productive manner, it is desirable to have an observability stack deployed in the cluster, which automatically scraps the metrics endpoint. Luckily, VictoriaMetrics has a handy Helm chart called victoria-metrics-k8s-stack that ships with both the Service and the RBAC configuration, as well as the scraping rules for the metrics and Grafana:
Since this is a test Kind cluster, we can opt for the vmsingle flavour - the default for the chart. After installing it, we can enter the vmagent pod and see what is available on the /metrics endpoint of kube-scheduler, using the service account credentials and passing the --insecure option (since the certificate bundle for Kind clusters is self-signed):
$ kubectl -n vm exec -it vmagent-vm-victoria-metrics-k8s-stack-68898f7ff5-npkwn -c vmagent -- sh
/ # curl -s -k --header "Authorization: Bearer $(cat /var/run/secrets/kubernetes.io/serviceaccount/token)" https://vm-victoria-metrics-k8s-stack-kube-scheduler.kube-system:10259/metrics |
grep 'queue_incoming_pods_total'
# HELP scheduler_queue_incoming_pods_total [STABLE] Number of pods added to scheduling queues by event and queue type.
# TYPE scheduler_queue_incoming_pods_total counter
scheduler_queue_incoming_pods_total{event="NodeTaintChange",queue="active"} 3
scheduler_queue_incoming_pods_total{event="PodAdd",queue="active"} 16
scheduler_queue_incoming_pods_total{event="ScheduleAttemptFailure",queue="unschedulable"} 3
Similarly, vmagent must be configured to skip certificate verification when scraping kube-scheduler while also overriding the server’s name. This can be done through Helm Values files. Here is my final overridden values file:
kubeScheduler:
  enabled: true
  endpoints: []
  service:
    enabled: true
    port: 10259
    targetPort: 10259
  spec:
    jobLabel: jobLabel
    endpoints:
      - bearerTokenFile: /var/run/secrets/kubernetes.io/serviceaccount/token
        port: http-metrics
        scheme: https
        tlsConfig:
          caFile: /var/run/secrets/kubernetes.io/serviceaccount/ca.crt
          insecureSkipVerify: true
          serverName: "127.0.0.1"
With this configuration in place, we can verify that metrics are being scraped by vmagent:
$ kubectl -n vm port-forward svc/vmsingle-vm-victoria-metrics-k8s-stack 8429:8429
Forwarding from 127.0.0.1:8429 -> 8429
Forwarding from [::1]:8429 -> 8429
$ curl -s localhost:8429/prometheus/api/v1/query \
  -d 'query=scheduler_queue_incoming_pods_total' |\
  jq '.data.result[] | .metric.__name__, .metric.event, .value'
"scheduler_queue_incoming_pods_total"
"NodeTaintChange"
[
  1712516523,
  "3"
]
"scheduler_queue_incoming_pods_total"
"PodAdd"
[
  1712516523,
  "16"
]
"scheduler_queue_incoming_pods_total"
"ScheduleAttemptFailure"
[
  1712516523,
  "3"
]
And start building dashboards for our experiments: